Introduction
Software evolution has taken us a long way from the mainframe to distributed computing in the cloud. What hasn’t changed is the need for operations teams to effectively manage the applications and infrastructure that businesses and organizations rely on. In this article, we will discuss how to effectively manage these composite/distributed/SOA applications by leveraging the existing expertise of operations teams along with tools and methodologies that ensure high availability, reduce the impact of outages, and cut out the reliance on costly all-hands bridge calls. In addition, we’ll give a few examples of how other organizations have adapted to these new software architectures and steps taken to prepare for them before they landed in production. Lastly, we’ll cover the cost of not doing anything and how that price is paid elsewhere.
Case Study: Cable Nation
The challenges for today’s operations teams are increasing exponentially, given the number of physical and virtual hardware layers that are used to provide a single piece of functionality. One fictional company that I’ll refer to throughout this article is a cable company called Cable Nation. Cable Nation used to be a small, regional cable provider with a single billing system that was hosted on a single mainframe system. At it’s infancy, the health of the billing system could be determined by the sole operations engineer who could log into the mainframe and check the vital system stats – CPU, memory, disk, IO rates and a few other key metrics that were hardly ever out of whack. Today, the billing system for Cable Nation stretches across multiple physical machines, virtualized devices, across many internal data centers and integrating with multiple external vendors. This rise in complexity solves many business-related issues involving disparate accounting methods across subdivisions, access to customer account information across organizations and ensuring that some of this data is available to external business partners. The architecture chosen to meet these new challenges is a SOA architecture.
Nowadays, tracking down a particular issue with the billing system involves a lot more servers, databases, applications, services and multiple mainframes. As a functional unit, the billing system continues to provide many of the same functions that it always has, but now it is much more difficult to find the root cause of a problem due to the distributed and complicated nature of this system. In many cases, the application architects are brought in to help resolve critical production issues, primarily because the operations teams are ill-equipped with their system monitoring tools to address what are now issues that can only be identified and isolated using application monitoring tools. In this paper, we will discuss some of the fundamental differences between the systems versus application management approaches and some of the tools and techniques that enable operations teams to more effectively manage these new systems with the same level of adeptness as they were able to when these systems were less complex.
In the broadest sense, the problems encountered in these distributed systems are tractable, and identification of the root cause of an issue is largely deterministic, based off of the capture of a few key metrics or key performance indicators (“KPIs”). In many cases, finding the source of a software problem may be tracked down to a single web service, operating on a specific machine, hosted in one physical data center, administered by a person who is responsible for the overall uptime of that service. However, companies like Cable Nation pay a huge price in terms of the number of hours spent by engineers on bridge calls, development tasks being delayed, or lost customers due to the inability to service them in a timely manner. This doesn’t even count the additional applications that depended on that single service that failed during the down time or the cost of missed external SLA’s tied to real dollars. Usually, these types of scenarios can be reduced with the appropriate amount of testing, but in many cases, the cause of downtime can be as trivial as a hardware upgrades or the application of a patch that causes unintended side effects. At the end of the day, there are always going to be problems in production and reasonable measures must be taken to alleviate the cost of those errors.
In essence, the primary cost of decreased availability and performance is due to the time and # of resources needed to resolve a problem. Consider this relatively conservative equation:
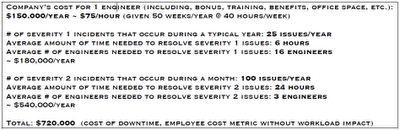
In this case, we’re looking at ¾ of a million dollars just for 125 issues!!! Imagine how quickly this number increases when you double or triple the # of incidents. Note that this was also a very conservative estimate. In many companies, the # of engineers involved in severity 1 & 2 issues is much higher – I’m sure many of you can relate to hanging out on bridge calls until a problem is resolved. Imagine how much money would be saved if the # of engineers needed was cut in half or the mean time to repair (“MTTR”) was reduced even by 25%? This is the magnitude of the problem and in this particular scenario, we’re considering that the # of incidents stays the same. In other words, there are some processes that we can put in place to reduce the potential # of incidents, but we’ll talk about those separately. The key to this is to recognize that the cost impact just in terms of people and their time is a large part of what we’d like to address as a part of this discussion.
In the case of Cable Nation, executive management had already recognized this cost was eating away at their ability to do business, in terms of both time spent resolving issues, but also in diverting time away from new development projects. In order to keep these costs under control and adhere to their hiring freeze, they began looking for tools that could address the main 2 factors they had control of:
* Reducing the time involved in resolving issues
* Reducing the # of people involved in issue/problem resolution
Taking a top-down approach, the best means of reducing the time to resolve problems isn’t simply getting more people involved, but rather arming a few key individuals with the appropriate quality and quantity of data that allows them to quickly pinpoint, triage, escalate, or resolve the problems in a matter of minutes. In the case of distributed applications, the sheer # of metrics that must be tracked is daunting in and of itself, but when those metrics and their relevance changes due to a few simple software modifications, then the ability to triage issues is compromised greatly. In the case of Cable Nation, the # of unique web services rolled out on a single release was measured in the 100’s initially. Only the developers and a few of the QA engineers knew how and when these services communicated with both internal and external systems. This dependence on the knowledge of developers and QA teams kept them constantly in the mode of fighting fires and taking on the role of operations staff due to the inability to track down issues using the same old methods. While the first release of the SOA re-architecture was deemed success, the second release was delayed multiple times, primarily because development was constantly brought in to resolve production outages and performance issues. The frustrating part for the developers was that they produced almost exactly the same # of bugs that they had when developing standalone (non-SOA) applications. The main difference was that the operations teams were ill-equipped to handle the complexities and issues associated with this new distributed architecture and so they were often unable to help solve problems.
So how do you prevent the scenario that Cable Nation faced? In other words, how do you arm operations with the effective tools and expertise to manage a SOA-based architecture? We will now begin to answer these questions and address the costs associated with not taking the appropriate steps…
Understanding MTTR
I had mentioned earlier the concept of Mean Time to Resolution, sometimes called Mean Time to Repair – luckily both can use the MTTR acronym. In the problem resolution process, there are actually 2 phases – problem identification and then the problem repair. In many cases, the identification phase is the most difficult. Usually, the symptoms of a particular issue may be similar to another that had been encountered, but often it turns out that the root cause is vastly different. Take the following example: “The database appears to be slow” is the issue identified, but the root cause may be due to a number of factors: network I/O, disk I/O, missing indexes, tablespace locations, SAN storage, etc. The key to effectively reducing the mean time to identification (“MTTI”) consists of having the best data and a person equipped with minimal training to interpret the data. For instance, in the case above, the MTTI could be reduced if the tier 2 support engineer was armed with an alert or report that tracked the performance of a single database query over time and was able to spot an increase in time. The escalation then would be handed off to the DBA who would tweak the execution plan for the query. All of this proactive identification and resolution may have very well taken place without having to raise a severity 1 or severity 2 incident.
Unfortunately, in complex software systems, humans are often the weakest link in determining the root cause of issues. In the best case scenario, all relevant system health and metric data would flow to a single engine that was able to rank, sort, categorize and analyze the data until the problem was detected. Once the issue was found, all the operator would have to do is press a big red button that made the problem go away once and for all. In reality, the big red button doesn’t exist, but there are many tools that provide the operations engineer the data that wil allow him to resolve the issue on his own and with in a fraction of the time it would normally take.
So What Makes SOA Management Different?
You’ll note that we’ve steered clear of the SOA terminology mostly through the previous paragraphs. From the perspective of the operations engineer, whether the application uses web services or adheres to a SOA architecture is not nearly as relevant as understanding the differences between system and application management. In other words, while it’s advantageous for operations teams to understand some fundamentals of SOA, it is not necessary for them to be experts in the lowest level details other than how problems should be identified and resolved. One example of this is the use of web services security – the operations team may need to know that there are web services that help govern the security of the SOA system and that there are key metrics that indicate whether or not the authentication system is operating at it’s optimal capacity (which is a combination of CPU utilization on the authentication web service, the # of concurrent authentication requests and an optimal connection pool to the authentication database). Operations engineers do not need to understand the specific authentication algorithms used or the fact that XML is the primary on the wire protocol. It is these differences that separate operations from development, QA and the business. At some point, the well-formedness of the XML or a buggy authentication algorithm may be identified as the root cause of an issue, but ideally the operations teams have ruled out all other problems before handing it off to the R&D engineers to investigate. Hopefully, the tools have also captured the information necessary to resolve these lower-level problems as well.
The differences between SOA/distributed systems management can be described primarily as a function of the # of unique services and the distributions of those services across the network. In addition to the distributed nature of the applications, the traditional application teams boundaries are a challenge as well. This can complicate the resolution of an issue because there are often more than one distinct development groups that develop a single “application”. This makes SOA application development quite different from more traditional development, and this has a downstream effect on how these applications are managed. The differences in SOA management versus more traditional non-distributed applications is summarized in the following table:
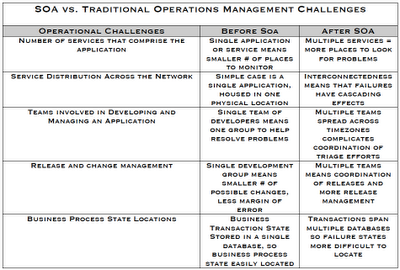
In order for operations teams to deal with these issues effectively, there are a few strategies that we’ll cover in the next section.
Developing a SOA Management Strategy
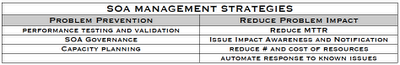
At the heart of any SOA management strategy, is the recognition that loose coupling brings along with it an increased amount of management. The traditional “application” may consist of a single web page along with two web services, or it may stretch across multiple service layers, consisting of both synchronous and asynchronous requests. The view for operations teams into these varied application topologies should be simple and consistent, so that when a performance or availability issue occurs, the exact location (physical, virtual, and relative to other services) can be identified along as the impact it has on other applications. The key elements of a cost-effective management strategy for SOA consists of the following elements:
Problem Prevention – Performance Testing
Obviously, the best way to resolve issues is to prevent them from occurring in the first place. The 1-10-100 rule should always be considered – it costs $1 to solve a problem in development, $10 to solve the same problem in QA, and $100 to solve it in production. To ensure that operations teams are ahead of the curve, the application and QA teams need to determine the Key Performance Indicators that are relevant to the operations teams. In many cases, this determination is a collaborative effort between QA, operations and development teams.
The primary need to identify KPI’s is to reduce the total # of potential metrics that an operations engineer is responsible for tracking and understanding. In some cases, this is a best guess based on performance data ascertained during performance testing, and in other cases this KPI data can simply be extracted by thumbing through help desk tickets, incident and problem logs, or simply by interviewing individual developers to identify components and/or functionality that may be cause for concern. At the end of the day, teams that conduct extensive testing not only root out problems before they creep into production, but as a side benefit – it helps to narrow down a core set of metrics that operations teams can utilize to track the health of the application in production.
In addition to manually identifying KPI’s, many application monitoring tools have out-of-the-box configurations that vastly reduce the time and effort needed to identify these KPI’s. For instance, HP Diagnostics monitors JVM heap memory, and web service request latencies without requiring developers to provide hooks or logging code to identify issues.
Here’s a few steps that can be used to start you down the road towards preventing issues before they crop up in production:
1. Establish baseline for production application KPI’s
2. Utilize the baseline and KPI’s for conducting realistic performance tests
3. Feed KPI’s back to development and architecture teams for use in planning additional system enhancements
Problem Prevention – SOA Governance
One of the most effective way of reducing production headaches is through the implementation of an effective SOA governance strategy. In the more traditional sense, SOA governance is largely concerned with providing a contract between the business and the IT organizations. The implementation of a governance strategy ensures that the business remains in control of it’s own destiny, instead of handing the reigns over to IT, crossing their fingers and hoping that the solutions provided meet the ever-changing demands of the business.
So what does an operations team care about governance in the first place? Well, the impact of a good governance strategy insures that the SOA architecture is designed to reduce the number of applications and services needed to meet the business demands. Reduction in the number of services needed to provide more or less the same functionality may halve the number of potential points of failure in a SOA-based architecture. Reuse of services is a key component to effective governance, but this reduces the overall number of potential failure points for the applications – in a sense more bang for the buck.
In addition to reducing the number of potential services deployed across an organization is also the insurance of setting policies on those services so that they behave as expected. For instance, setting policies that restrict or limit access to certain services ensures that web services aren’t utilized outside their defined scope. This level of problem prevention and runtime governance of services can be accomplished using HP’s SOA Policy enforcer. The importance of policies can’t be more relevant when operations engineers are faced not only with the uptime management of services, but of the legal and business requirements that they remain compliant.
Problem Prevention – Capacity Planning
Another effect a SOA governance strategy has on operations is by informing of additional services that will be deployed in subsequent releases so that operations teams can make the best use of existing resources or gain enough lead time to plan for additional capacity. Services definitions include the anticipated quantity of requests expected and combining this with the service monitoring tools will ensure that hardware can be allocated in sufficient quantity to serve additional service demands.
Additional runtime metrics obtained by SOA management tools like HP’s BAC for SOA gives operations and developers realtime performance data that can be used to identify bottlenecks, thereby providing capacity where it was previously constrained.
Reduce Problem Impact – Reduce MTTR/MTTI
As we saw earlier, the cost of reducing MTTR is measured in the millions of dollars for even a modest number of issues. Any steps that can be taken to reduce the time to identify and resolve a problem will drastically reduce the cost to the business. In the case of SOA applications, the need to proactively monitor and alert on problems gains additional significance due to the greater potential for a single service to effect a larger number of applications. The more difficult challenge for the operations teams is simply to understand and be able to visualize where to begin tracking down problems.
The first step to reducing MTTR is to do everything possible to identify problems before they become critical. Reducing a problem from a severity 1 issue to a severity 2 issue is one of the key practices employed by successful operations teams. There are 2 means of helping to identify problems before they raise in severity:
* Active monitoring – to help identify issues before end users experience them
* Passive monitoring - with trend-spotting capabilities
Active monitoring is accomplished primarily through the use of simulating end users, or in the case of web services – service consumers. These business process monitors (“BPM”s) regularly perform requests that occur on a daily basis. These monitors may be tied into a deep-dive monitoring tool that provides end-to-end visibility of where bottlenecks occur or where there are service interruptions by tracking every network byte sent and all the way down to the line of code executed by the web service. HP’s BAC for SOA software provide this top-down monitoring capability, allowing operations to be notified as soon as a service begins misbehaving. Once the service is identified and metric snapshot is taken (via HP Diagnostics for SOA), the operations staff has the information necessary to pinpoint the root cause of the issue or provide high quality metrics to a tier 2 or tier 3 engineer for additional troubleshooting.
Passive monitoring along with trend analysis can help to identify problems that emerge over time. For instance, the auto-baselining feature of HP BAC along with the Problem Isolation module informs the operations team when there is an aberration in the metrics. For example, a metric that captures the response time for a web service could be auto-baselined and as the service response time starts to degrade (due to higher request volume or latency in it’s database requests), then an alert would be sent to the operations team for investigation.
The shift for operations teams in managing SOA applications is that many of the existing tools used to chart performance and availability simply don’t work as well in a distributed/SOA-based architecture. In even the simplest of SOA architectures, the path a transaction follows is largely dependent on the data contained in the request. Services route requests to the appropriate recipients and so when errors occur or transactions fail to complete, the determination of where the failure occurred often requires knowing what individual user sessions initiated the request and what the request contained. Because the data is split across multiple service layers, the ability to trace a specific request is reduced unless tools that provide end-to-end transaction tracing are employed.
Adding to the complexity, many SOA-systems consist of multiple vendor’s SOA application servers and messaging solutions. Any tool used to monitor these systems must take into account the heterogeneous nature of these systems and still present a common view to the operations teams. No matter how good an engineer may feel their skills at problem solving may be, the challenges presented by a vast array of web services infrastructure is daunting, even to the seasoned pro. The worst case scenario is for every system to be monitored by a different vendor-dependent tool and so problem identification is hampered because they are constrained to their own environment and don’t capture the interactions between system boundaries, which is the place where issues most often occur.
In this case, the operations teams need a single pane of glass into this new layer of application architecture. Tools such as HP’s Diagnostics for J2EE/.NET/SAP can provide service and application-level metrics along with automatically discovering application topologies by tracing requests across system boundaries. Tools like HP’s TransactionVision provide even deeper insight into the data-dependent routing of requests through heterogeneous SOA-based architectures by capturing events spanning J2EE containers, .NET CLR’s, MQ queues, Tuxedo systems, or even CICS or IMS calls. Knowing exactly where a fault occurs is one of the biggest issues with SOA applications. If operations teams are provided the appropriate tools, then the tried and true operations procedures begin to kick in. Otherwise, developers and QA staff will continue to be pulled into every issue and instead of empowering operations with the tools and processes to manage these new SOA applications, operations will be handled by developers and no one will be left minding the store.
Reduce Problem Impact – Issue Impact and Awareness
Due to the inherent interconnectedness of SOA-based architectures, the need to reduce the impact of outages has risen in importance. The additional dependencies between applications and services require operations teams to understand the effects configuration changes have on dependent services. Though the use of application topology discovery and service dependency mapping, operations teams can isolate the impact that changes have across all applications dependent on a single service.
In terms of cost, operator configuration changes account for upwards of 60% of unplanned application downtime. In the case of SOA applications, this impact can stretch higher when operators and configuration managers are unaware of service dependencies. Though great pains my be taken by the SOA governance teams, the ability to quickly detect service changes and additional consumers can result in additional downtime due to the unexpected consequences of change. In order to restore service to a malfunctioning web service, operations teams need to have the full picture of which services upstream or downstream will be effected by an upgrade or change so that adequate measures can be implemented to reduce service disruption.
Once again, tools are essential to map dependencies between systems, especially those that keep the models up to date on a minute-by-minute basis. HP’s Dynamic Discovery and Dependency Mapping (“DDM”) and TranscationVision software tools empower operations teams with a clear picture of service dependency and allow them to determine the moment a transaction is failing to complete whether due to a bug in the code or due to a malformed request. Visualization allows operations teams to proactively notify the businesses when an outage occurs so that they can take the appropriate steps to work around the problem. This level of interaction with the business ensures a positive dialog with the IT organization.
Reduce Problem Impact – Reduce # and Cost of Resources
In the same vein as reducing MTTR, the reduction in the number of resources required to solve an issue is a critical step in developing an effective SOA management strategy. Best case scenario is that a tier 1 or tier 2 operations engineer utilize a single dashboard that notifies them of events and aids in the correlation so that a root cause is identified more quickly. The worst case scenario is one that many of you are familiar with – bridge calls lasting multiple hours or even days. By far, the best way to reduce the number of people involved in a bridge call is to provide a smaller subset of engineers with KPI data to quickly pinpoint issues.
After the problem identification step, the quickest route to a resolution is to escalate the problem to the appropriate person or team that has the experience to solve the issue the quickest. In many cases, the process of triage in and of itself is complicated with SOA applications due to the sheer number of groups supporting a single piece of functionality or transaction type. In these cases, having the tools that pinpoint the team and owner of a service or application can greatly reduce the unnecessary calls and time wasted pinpointing the expert who can resolve the problem the quickest and with the smallest impact on other resources.
Another important aspect of resource reduction is the empowerment of tier 1 and tier 2 engineers to resolve issues on their own. Even if they are unable to pinpoint the exact root cause, the engineers can be supplied with run books or standard procedures that ensure they collect the most pertinent data before escalating to other tiers. Additional tools can enable these tier 1 and tier 2 engineers with automated processes for narrowing down problems. Software tools like HP’s Operations Orchestration enable these operations teams to perform a series of steps to help troubleshoot problems before requiring the assistance of a tier 3 resource. Automatically checking log file contents, pinging servers, or capturing performance metrics can reduce the time spent by involving more advanced techniques and more expensive resources. In other words, the more that can be done to automate the problem resolution process, the less time is needed by engineers downstream.
Conclusion
As we’ve seen, the operational management needs surrounding SOA are in many ways the same as those for more traditional web-based applications. The fundamental differences come down to a few key areas and require operations teams to employ new tools that provide them the insight they need to effectively manage these new SOA-based architectures. The key to an effective strategy is to recognize that operations teams need to be aligned in much the same way that architecture teams have met this new distributed application paradigm. The alternative is for these same development teams to spend more time doing the work of operations teams – which is a very cost inefficient way to manage applications. The most critical component to enable operations is to empower them with the tools and expertise that ensure that they continue to support the business’s most important IT assets.